It's Not the Cotton, It's the Dryer
A full cradle-to-grave life cycle assessment of a hooded sweatshirt, built in OpenLCA for my Life Cycle Analysis course. I modeled five real-world scenarios, manufacturing location, wash habits, and drying method, to find where a garment's environmental impact actually comes from. It isn't where most people would guess.
Where does a sweatshirt's environmental impact actually come from?
Most conversations about a garment's footprint stop at the fabric. I wanted to know whether that's actually where the impact lives, or whether it's really about how people use and care for the thing after they buy it.
- Functional unit: one 750g hooded sweatshirt, worn twice a week and washed once a week, over a year
- Scope: raw cotton and brass extraction through manufacturing in India, distribution to Berlin, a year of use, and disposal
- Goal: find the highest-impact life stages, then test how much five realistic scenarios could change that picture
environmental impact categories assessed under the Environmental Footprint 3.0 method, from climate change and freshwater ecotoxicity to mineral resource scarcity and water use.
Five scenarios, one functional unit, real OpenLCA modeling
I built the full life-cycle inventory in OpenLCA, from yarn production through end-of-life disposal, then varied five variables one at a time to isolate what actually moves the needle.
- Modeled the base case in Maharashtra, India, then swapped in Odisha to test whether manufacturing location mattered
- Varied wash load size, wash frequency, and drying method to test how much user behavior mattered
- Used the ecoinvent database and the Environmental Footprint 3.0 method to assess impact across acidification, climate change, ecotoxicity, eutrophication, human toxicity, resource use, and water use
The Model
A full cradle-to-grave inventory: cotton and brass extraction, yarn and textile production, manufacturing in India, distribution to Berlin, a year of washing, and municipal disposal.
The Scenarios
Five variants tested against the base case: a second manufacturing region, a fuller wash load, half the wash frequency, and machine drying instead of air drying.
The Method
Environmental Footprint 3.0, scored across 16 categories from climate change to mineral resource scarcity, using the ecoinvent database.
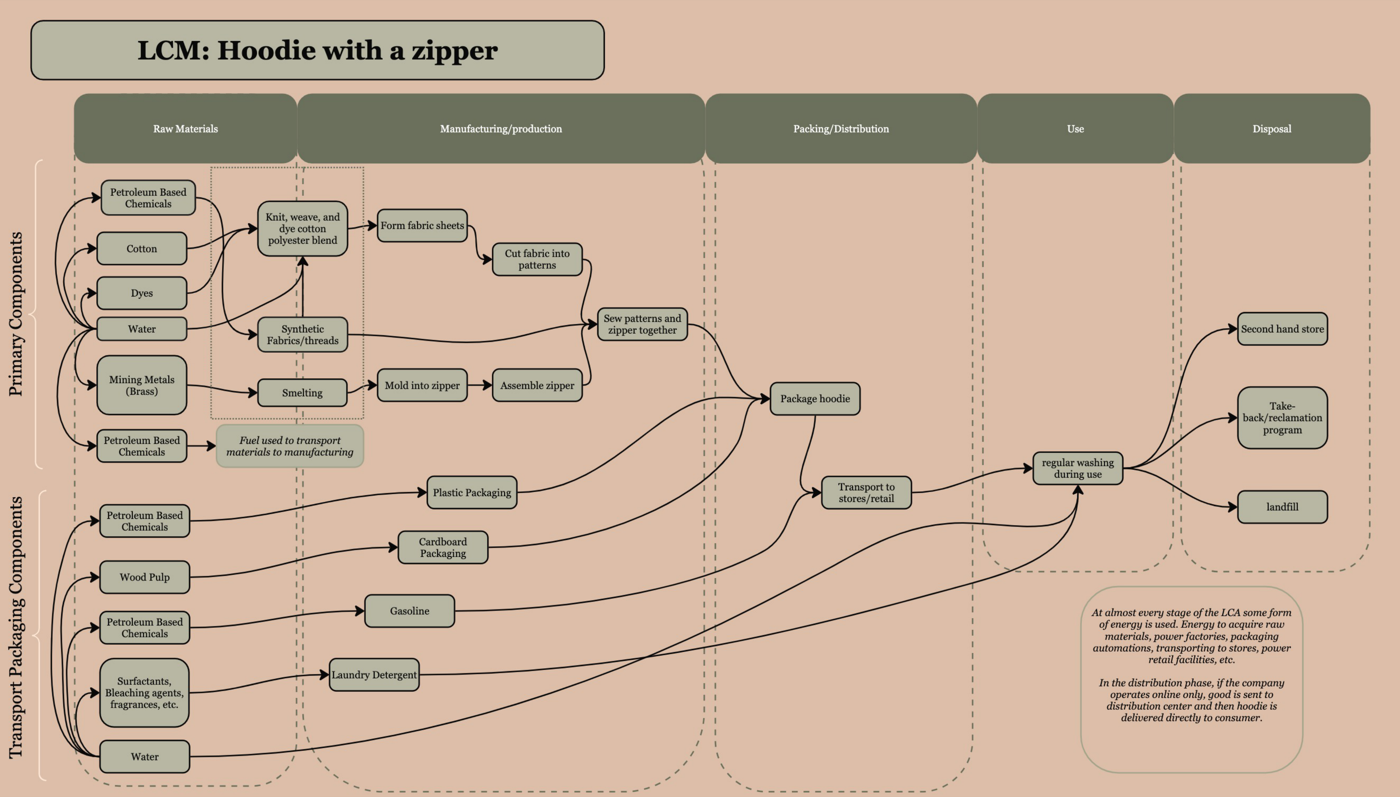
The life cycle model I mapped for this same garment earlier in the course, tracing every input from petroleum-based dye through end-of-life disposal.
The wash and dry cycle mattered more than where it was made
In the base scenario, climate change, freshwater eutrophication, and resource use (both fossil and mineral) were the four largest impact categories, and manufacturing location barely moved any of them. What actually shifted the numbers was what happened after the sweatshirt left the store.
56.4%of the sweatshirt's climate change impact comes from the use phase, machine washing specifically, more than manufacturing itself (38.9%).
Climate change impact vs. the base scenario
Switching manufacturing location (Maharashtra to Odisha) barely moved any impact category, the electricity grid mix was nearly identical. Every wash-behavior change did move the needle, in both directions.
Try the drying method yourself
Everything else held constant, just swapping air drying for a tumble dryer more than doubles the sweatshirt's impact on three of four major categories.
The fix is mostly downstream of the factory
Because the use phase dominates, the highest-leverage changes aren't in how the sweatshirt is made, they're in how it's cared for.
For the Wearer
Air dry instead of machine dry, wash full loads instead of partial ones, and wash less often where possible. Cutting from 52 to 26 washes a year alone cut climate impact by 29.4%.
For the Brand
Care labels and packaging inserts that actually push air drying, since the manufacturer has real influence over a behavior that outweighs their own production choices.
For the Supply Chain
Reduce energy intensity in yarn and textile production, look for alternatives to brass hardware (the zipper alone drives 57% of the mineral resource impact), and build in a real reuse or recycling path, since none currently exists at end-of-life.
Two more products, same framework
Applied the same cradle-to-grave process to a couple of very different products this semester.
Stadium Concessions
Paper vs. Plastic vs. Reusable: The Cup Case
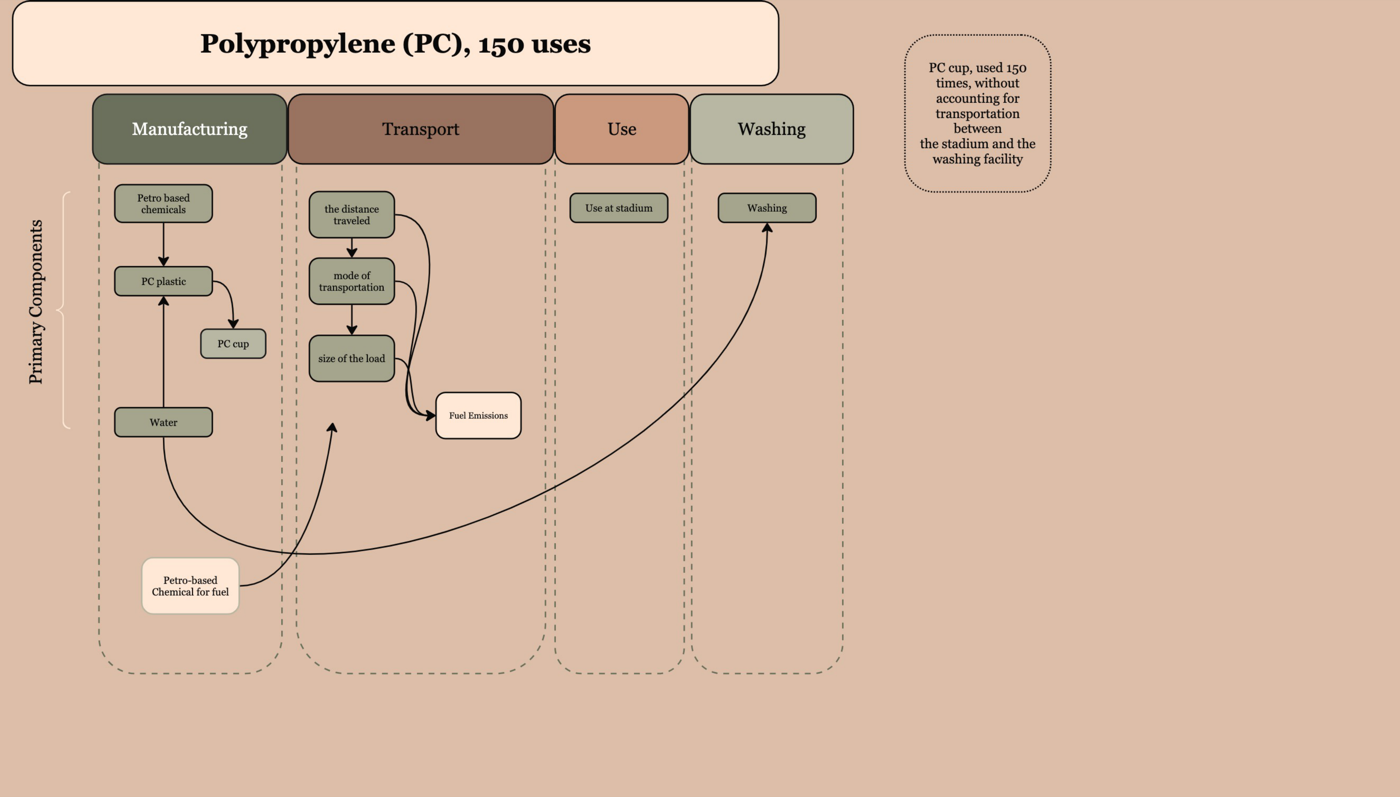
- Compared paper, single-use PET, and reusable polypropylene cups for stadium and event use, using the Eco-Indicator 99 method
- A reusable cup used 150 times, with no losses, scored roughly 18x lower impact than a single-use PET cup
- But that advantage depends entirely on the return-and-wash system: once transport and a 5% loss rate are factored in, the reusable cup's impact nearly doubles
Industrial Logistics
Do Bigger Trucks Actually Help? The Freight Transport Case
- Modeled Longer and Heavier Vehicles (LHVs) against standard trucks in Germany, using ReCiPe 2016 and the ecoinvent database, in two layers: the vehicle alone, then the vehicle plus road infrastructure
- LHVs use about 24% less fuel per tonne-kilometer, but produce 1.5x more brake wear emissions, giving them a 14% higher terrestrial ecotoxicity impact
- The bigger risk: a 30% increase in total freight volume would erase all of the LHV's environmental benefit, since fewer, bigger trucks only help if they don't just enable more shipping overall
The most useful sustainability lever is usually the boring one
Building this model taught me to distrust my own assumptions about where impact "obviously" lives. I expected the story to be about cotton and dye and shipping distance, the visible, dramatic parts of a supply chain. Instead, the biggest lever turned out to be something almost nobody thinks about: how a person dries their laundry. That's not a satisfying headline, but it's the honest one, and it's the same lesson I keep relearning in policy work: the highest-leverage fix is rarely the most visible one, and good analysis means following the data there even when it's less exciting than where you expected to land.
The factory isn't where this sweatshirt's footprint gets decided. The laundry room is.